I'll be honest. I love infographics every bit as much as the next hungry information consumer. I adore the snapshot presentation of facts that gives me a glimpse of the impact and reach of certain phenomenon. (In fact, I'm producing a science show for kids that uses this approach very heavily.)
BUT -- I also know that one must be careful to check the underlying facts and the methodology with which the picture in an infographics is assembled. There is an old saying that "figures don't lie, but liars can figure." If you also consider the timeworn saw that "a picture is worth a thousand words" you can deduce that liars who can figure AND who can create infographics have 1000 more ways to lie!
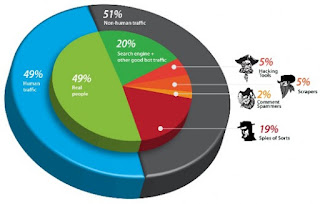
Here's one from an article I saw recently.
BUT -- I also know that one must be careful to check the underlying facts and the methodology with which the picture in an infographics is assembled. There is an old saying that "figures don't lie, but liars can figure." If you also consider the timeworn saw that "a picture is worth a thousand words" you can deduce that liars who can figure AND who can create infographics have 1000 more ways to lie!
Here's one from an article I saw recently.


